 |
|
Analyze more Complex Linear Models
SYSTAT 12 has extend the scope of analysis of linear models like Regression, Analysis of Variance and General Linear Models (GLM) to tackle correlated data, clustered data, dependent data and heteroscedastic data. Use SYSTAT's Mixed Model Analysis to analyze various types of linear mixed effects models like variance components models, hierarchical mixed models, and mixed regression. Obtain different types of estimates of fixed effects parameters and variance components,
predictions of random effects, all with confidence intervals and hypothesis tests.
|
|
Ease Your Way through Analyses with Theme Menus, Customizable Menus and Toolbars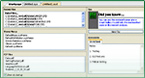
Choose a theme menu to suit your field of application. Exploit SYSTAT's flexibility in organizing the menu and toolbar to suit your type of work, needs and convenience. Reorganize menu and toolbars to access most easily the features that you use most.
|
Extend your Analysis with Partial Least Squares and Robust Regression
Use Partial Least-Squares Regression when the data set includes a large number of predictor variables, greater even than the number of cases. SYSTAT provides two standard algorithms - NIPALS and SIMPLS. Obtain standard errors of the estimated regression coefficients by the Jackknife procedure. Validate the fitted regression by one of two types of cross-validation procedures, viz., leave-one-out and random exclusion.
When a standard multiple linear regression procedure shows up problems with your data set, use a suitable one of SYSTAT's Robust Regression procedures (LAD, LTS, LMS, S, M, Rank) to solve your problem.
|
|
Save Time with Intuitive Start Page, Boasting Interlinked Menu/Command Interface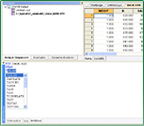
Through the Start Page, gain instant access to Recent Files used, obtain useful Tips, access Theme Menus, read PDF Files of Manuals and keep notes on the Scratchpad.
Choose either the simplicity of a menu-driven interaction, or the power and control of SYSTATs command line interface
or a combination of the two! SYSTATs scripting command language and menus work in tandem to provide users the utmost convenience.
|
Develop, Improve and Optimize the Performance of a Process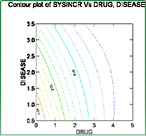
Using data from a well-designed experiment, invoke Response Surface Optimization to work out the levels of input factors and process settings that will produce the best yield in terms of product characteristics. Estimate response surface parameters, carry out analysis of variance and tests of significance, compute optimum factor settings, produce contour and desirability plots, and carry out ridge analysis.
| |
Get More Flexible Output with Longer Variable Names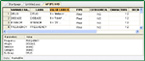
Use variable names and string variable values up to 256 characters. You no longer need to abbreviate variable names in output. Thus you may export output in a suitable form needing very little editing.
|
Easily Detect Groupings in Data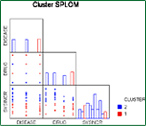
SYSTAT's Cluster Analysis gives you a wide variety of distance and similarity matrices, clustering criteria, validation indices, and cutting and pruning methods to get a most satisfactory hierarchical classification or grouping from the data. Use new linkage methods which include uniform and kernel,
| |
Speed up Your Analyses with Data and Variable Tabs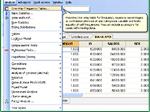
Equip your analysis with SYSTAT 12's Variable Tab in the Data Editor. Keep your analyses organized with separate tabs to access Data View and Variable View. Use the Data View for simply browsing and editing your data.
SYSTATs Variable View has two parts: the first provides information about variable names such as type, width etc. The other part shows processing conditions like Frequency, Case selection, etc.
You can also see variable comments in the form of a tooltip by moving the cursor to the variable name in the Data tab. With so much information available at a mouse-click you can better organize your data, and speed up your analysis time.
|
Take Control of Your Charts and Graphs with a New Interactive Dialog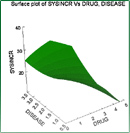
Use SYSTAT's wide range of scientific and technical graphs to present your analysis and customize them to suit your requirements. Use the new Interactive Dialog to change multiple aspects of your graphics using a single integrated dialog box.
| |
Get More Out of Your New Version of SYSTAT with a Host of New Features
Use the wide range of new features that SYSTAT 12 brings to you, especially designed to make your analysis easier than ever before. For example, you can get instant information about all the procedures you need with the Bubble Help.
Perform real-time analysis and enhance the power of your analysis with greater customization than ever before with the new Example Command Files and Status Bar. SYSTAT 12 has a host of new features just waiting to be explored!
|
Present Visually Useful and Attractive Summary of Large Data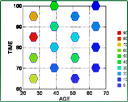
Use SYSTAT's Hexagonal Binning, a form of bivariate histogram, for an advanced version of scatterplot for large data sets. Hexagonal binning plots divide the screen on a hexagonal grid. The radius of the hexagons is the same throughout but its color depends on the range of the frequency of the x-y values.
| |
|
|
|